
OCTOBER 2026 MARKET ANALYSIS FOR CHICAGO'S NORTH SIDE
Our monthly market analysis details six real estate metrics for the Near North Side, Lincoln Park, Lakeview and North Center comparing four neighborhoods and price ranges. There is also a button for each metric which shows detailed, interactive charts for monthly, YTD and ten year trends.
SEPTEMBER OVERVIEW
September presented a steady but selective housing market, with conditions varying by neighborhood and price point. Buyers remain engaged, although they are approaching purchasing decisions thoughtfully and responding most strongly to homes that offer the right combination of location, condition, and value.
Inventory continues to be an important influence on the market. With fewer homes available and new listing activity remaining measured, supply has stayed relatively limited. This has helped support home values even as sales activity has varied across different segments.
Overall, the market continues to demonstrate stability. Buyers have opportunities but may face limited selection in desirable segments, while sellers can continue to benefit from relatively constrained competition when their properties are positioned appropriatel
September reflects a balanced and resilient market environment. Buyer demand remains active but selective, while limited inventory continues to provide support for home values. As the fall market progresses, well-priced and well-presented properties should remain well positioned to attract buyer interest.
Please let us know if you need information on any of Chicago’s other neighborhood
SEPTEMBER HOME SALES
Year To Date 2026 vs 2025 - Down 6.9%
September 2026 vs 2025 - Down 14.0%
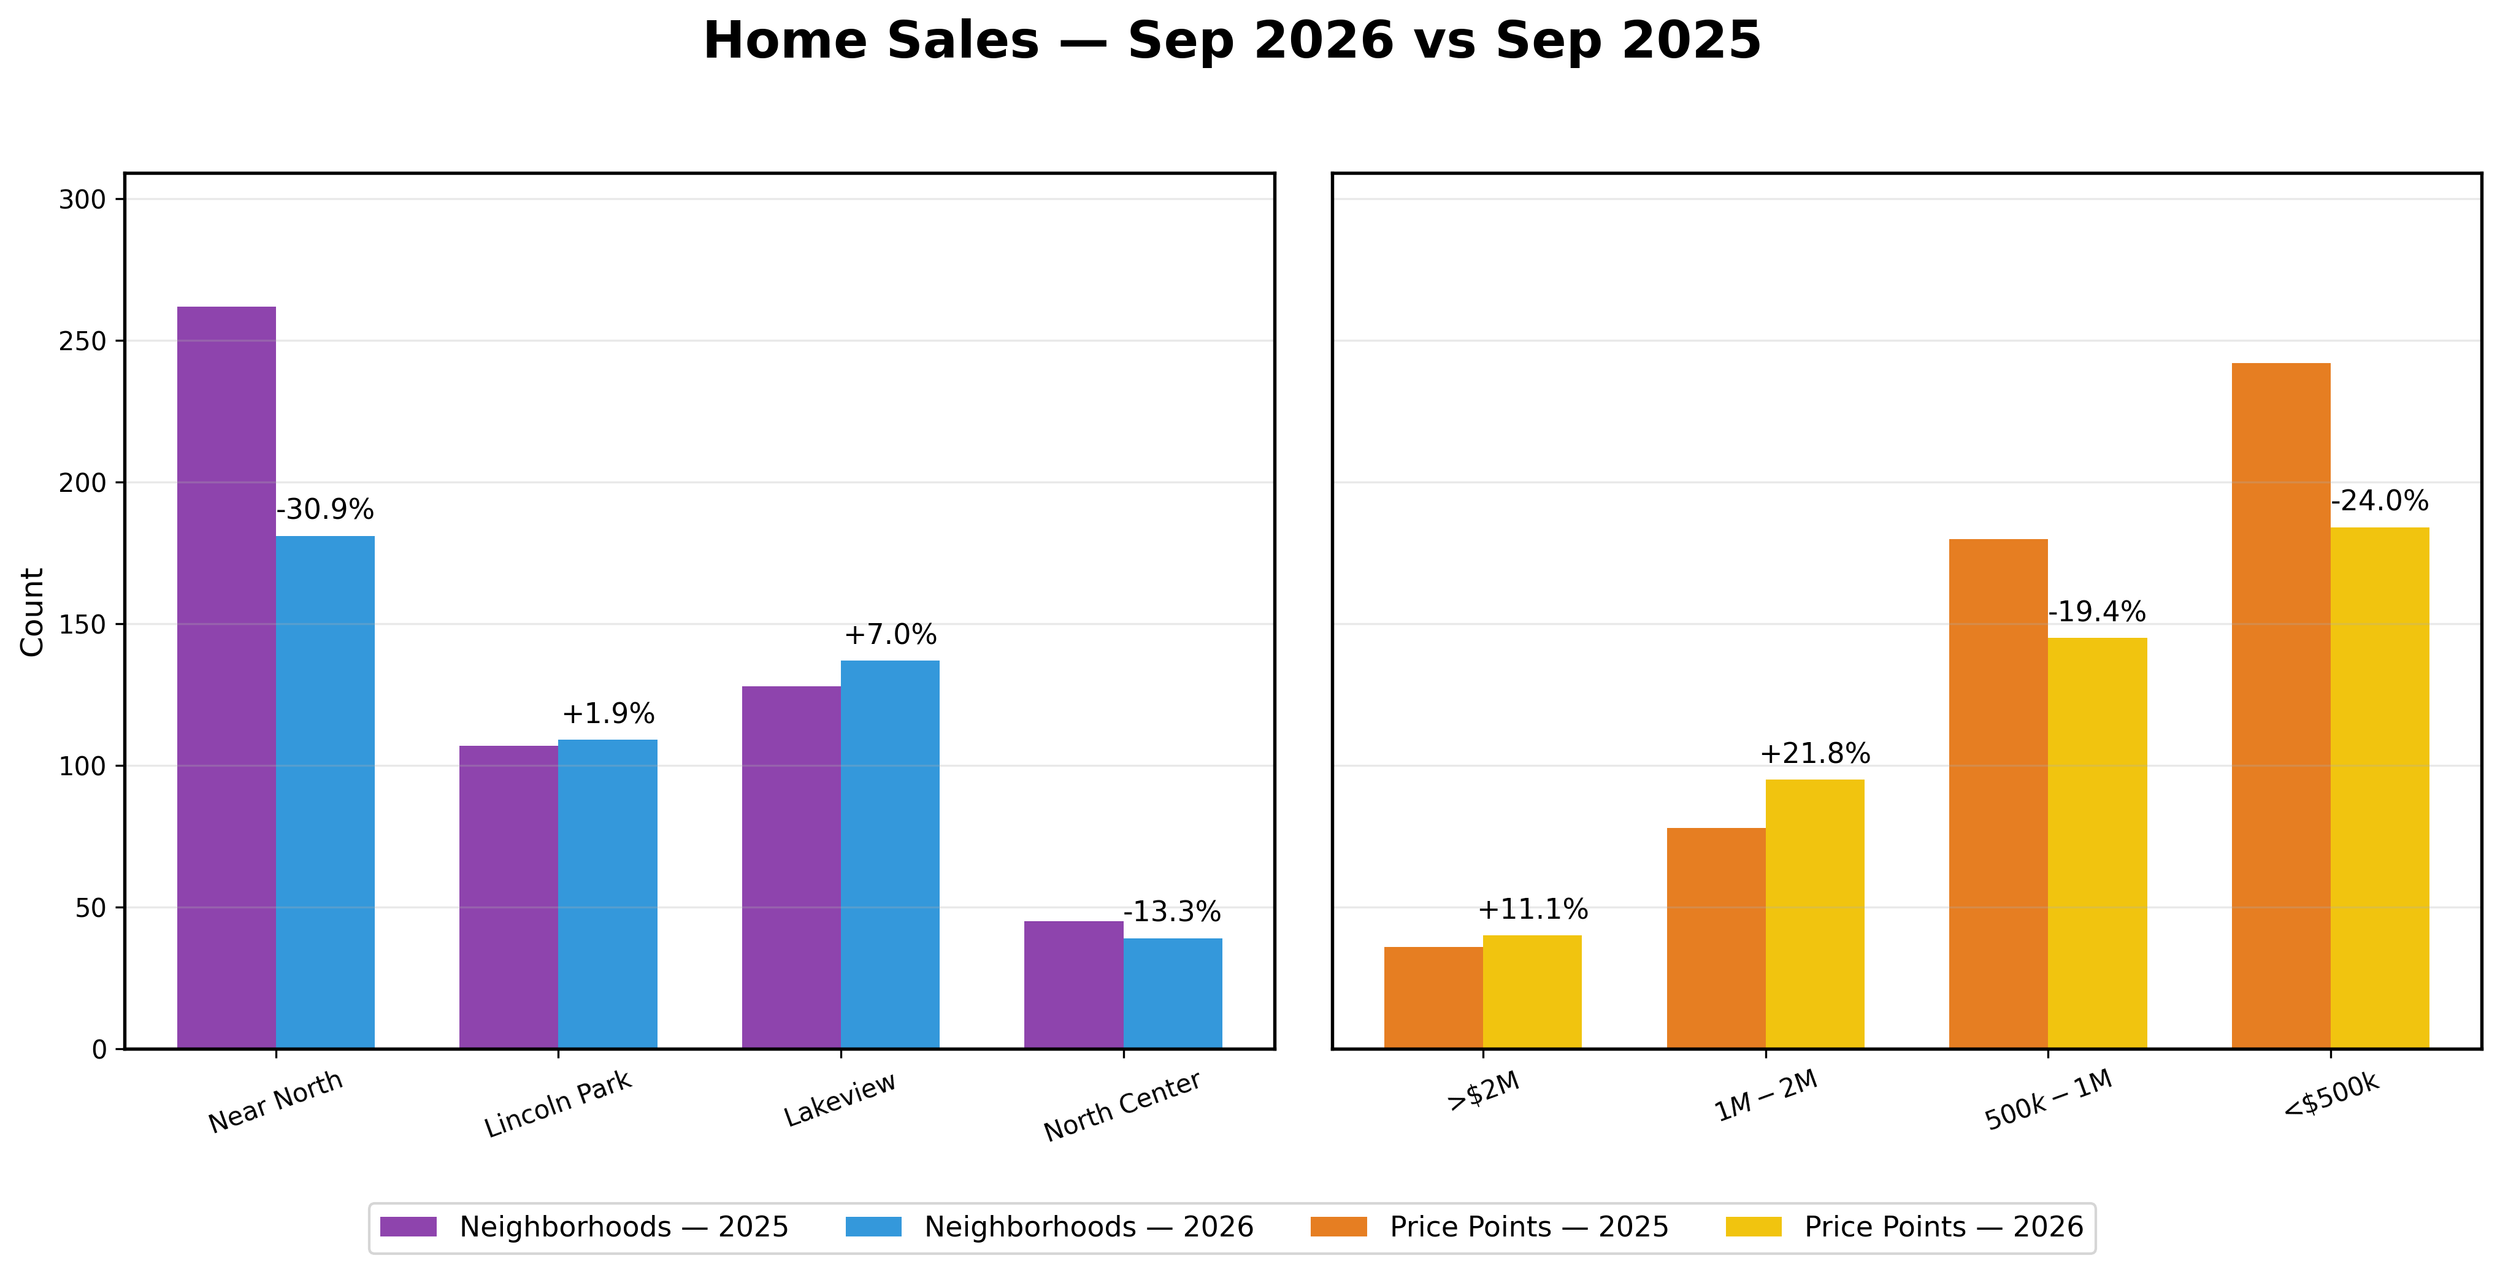
NOTEWORTHY: Home sales were somewhat lower overall in September, with results varying across neighborhoods and price points. Near North and North Center experienced slower activity, while Lincoln Park and Lakeview showed modest year-over-year improvement.
By price point, the $1M–$2M segment performed particularly well, while activity in the other price ranges was somewhat more measured. Overall, the results suggest buyers remain active but are taking a thoughtful approach to purchasing decisions.
Buyer demand remains present, although activity is increasingly dependent on location, price, and property quality. Homes that are well positioned for the market continue to attract interest.
SEPTEMBER HOMES UNDER CONTRACT
Year To Date 2026 vs 2025 - Down 5.1%
September 2026 vs 2025 - Down 0.8%
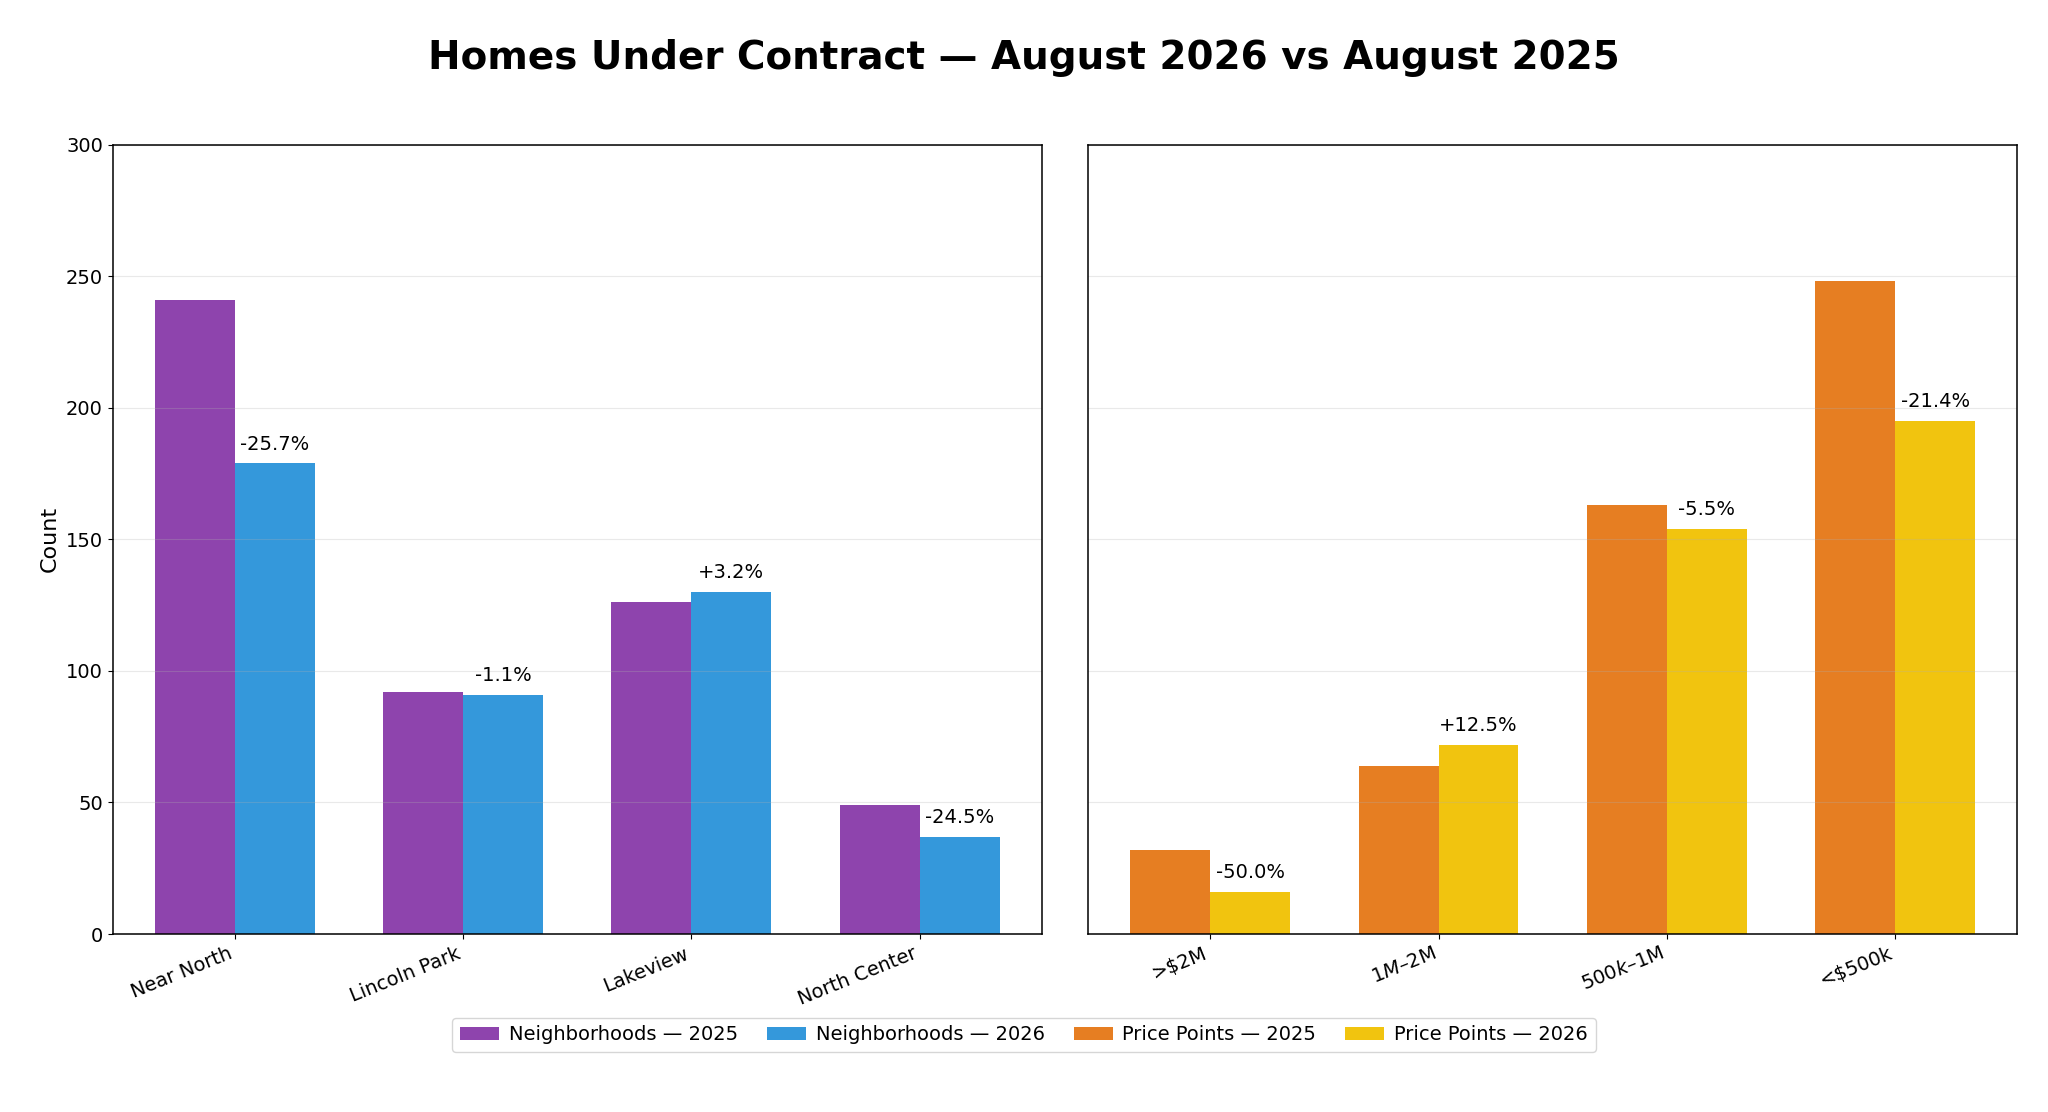
Noteworthy : Contract activity remained relatively steady in September, with encouraging results in several areas. Lakeview and North Center saw increased activity, while Near North and Lincoln Park experienced modest year-over-year declines.
The $1M–$2M segment showed notable strength, while the remaining price categories were generally stable to moderately lower.
Pending sales point to a market where buyers remain engaged. Activity varies by segment, but appropriately priced homes continue to generate interest as buyers respond to attractive opportunities.
SEPTEMBER HOMES FOR SALE
Year To Date 2026 vs 2025 - Down 24.8%
September 2026 vs 2025 - Down 21.5%
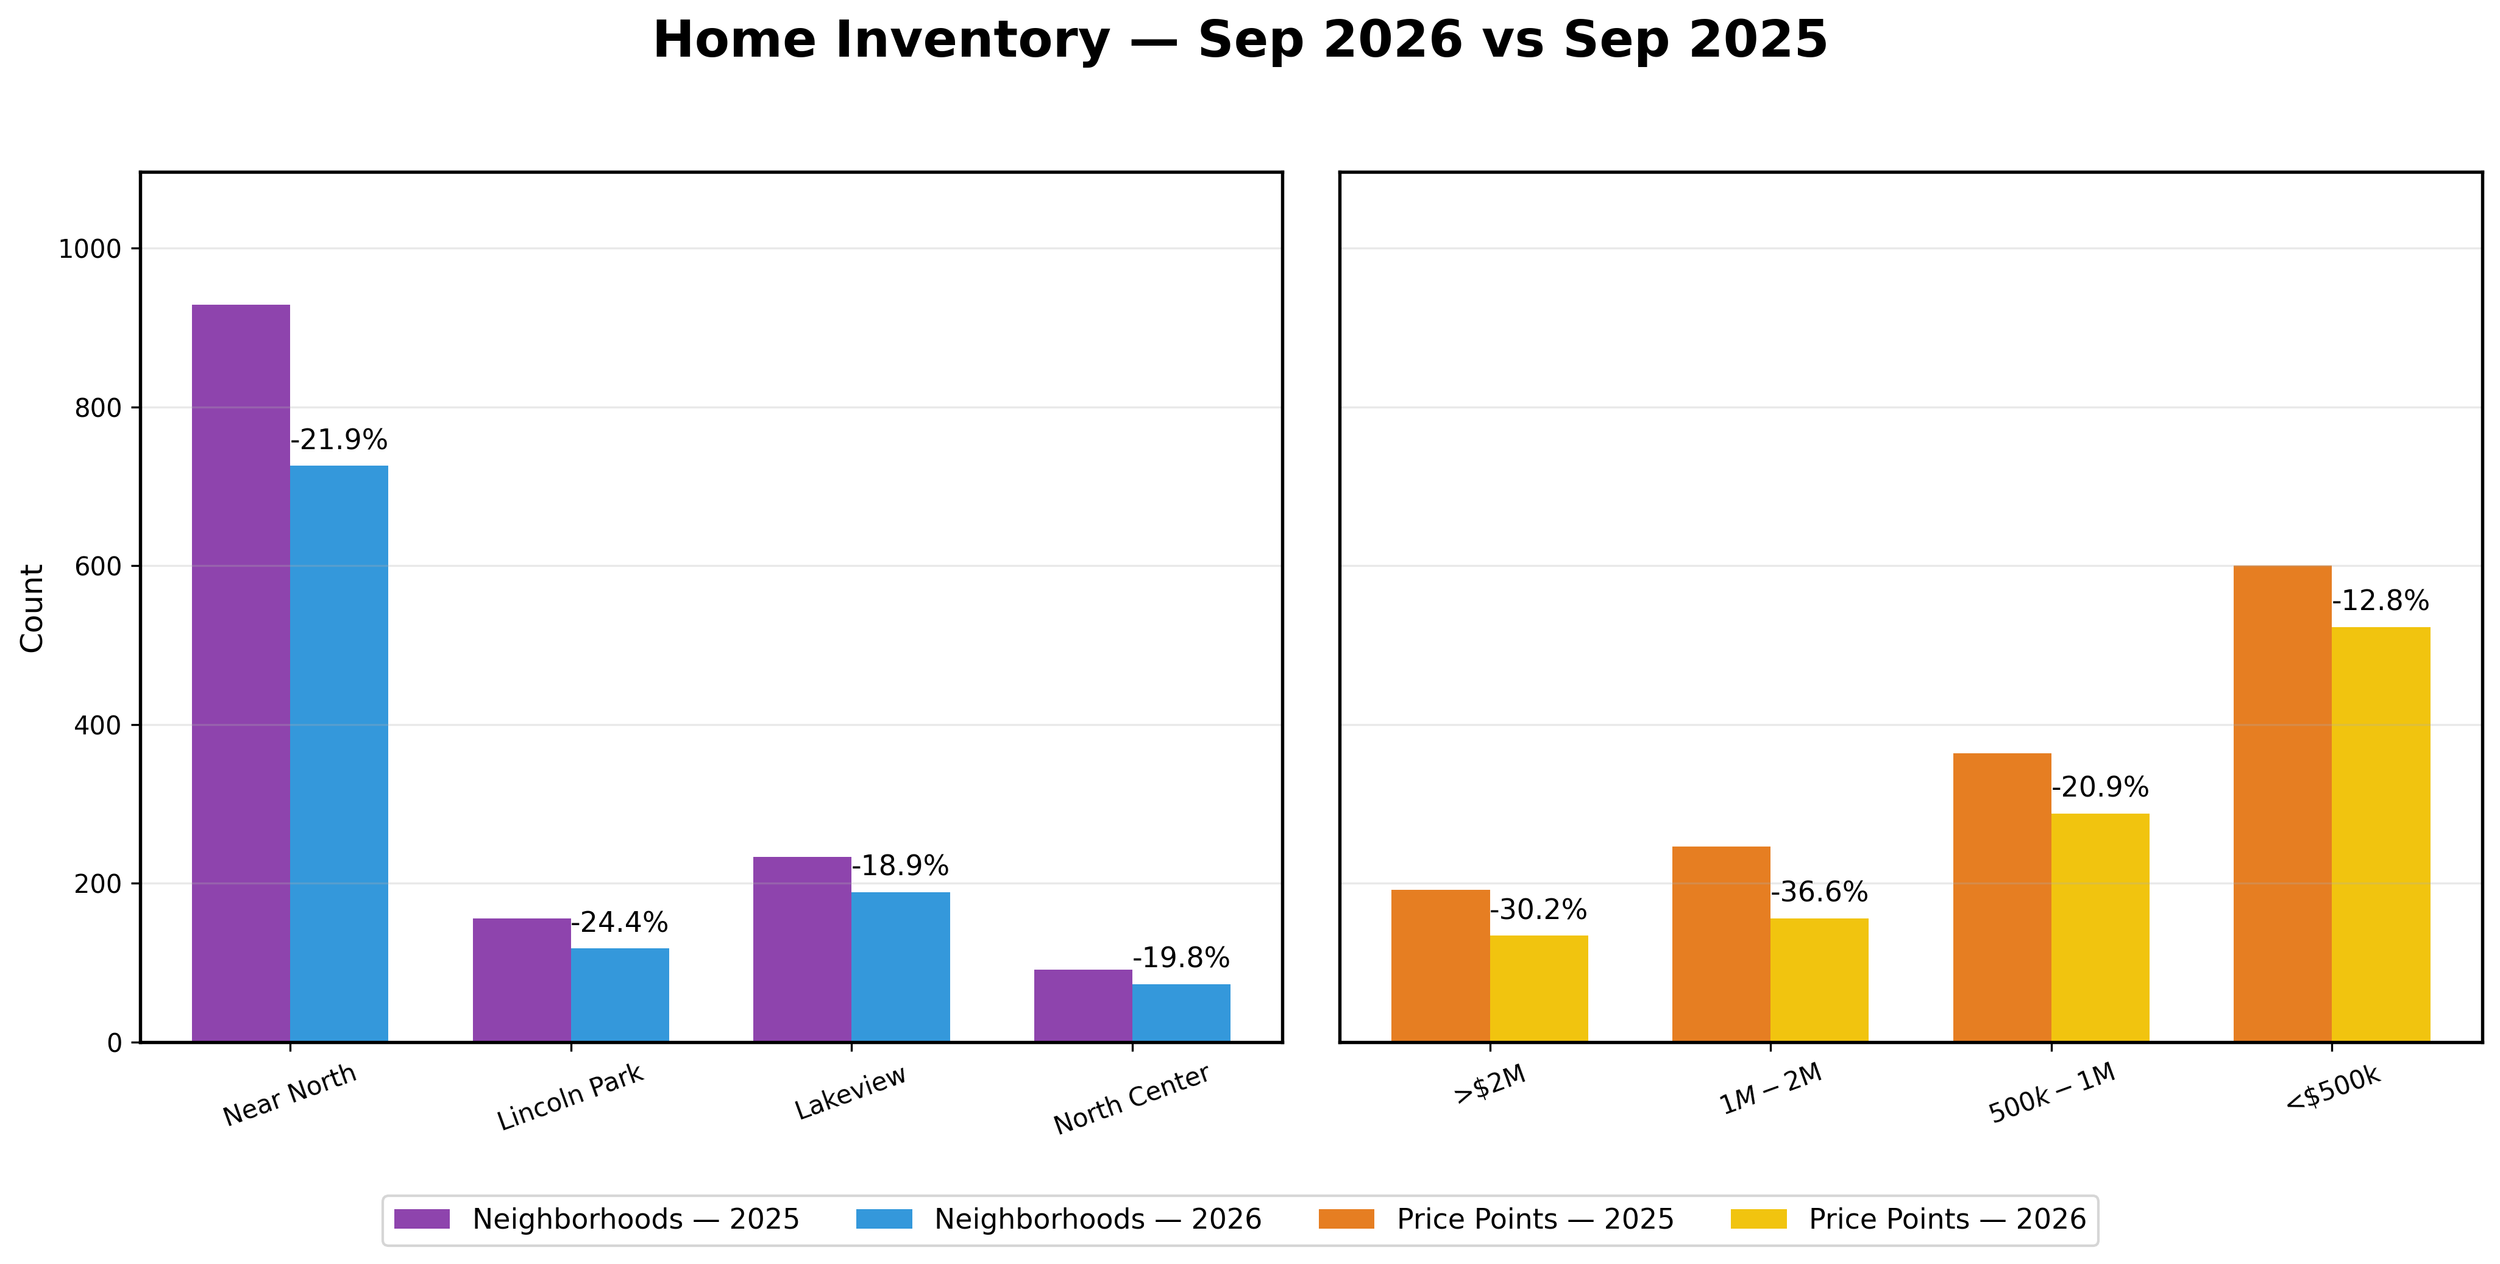
Noteworthy: Inventory remained below last year's levels across all neighborhoods and price ranges. While this continues to limit the number of choices available to buyers, it also helps maintain a relatively balanced relationship between available supply and current demand.
The reduction in inventory was broad-based, affecting both higher-priced properties and the more active portions of the market below $1 million.
Available inventory remains limited, which continues to support well-positioned listings. Buyers may have fewer choices, while sellers with desirable properties remain well placed to benefit from current market conditions.
SEPTEMBER MONTHS OF SUPPLY OF INVENTORY
Year To Date 2026 vs 2025 - Down 18.1% to 1.8 MSI
September 2026 vs 2025 - Down 10.0% to 1.8 MSI
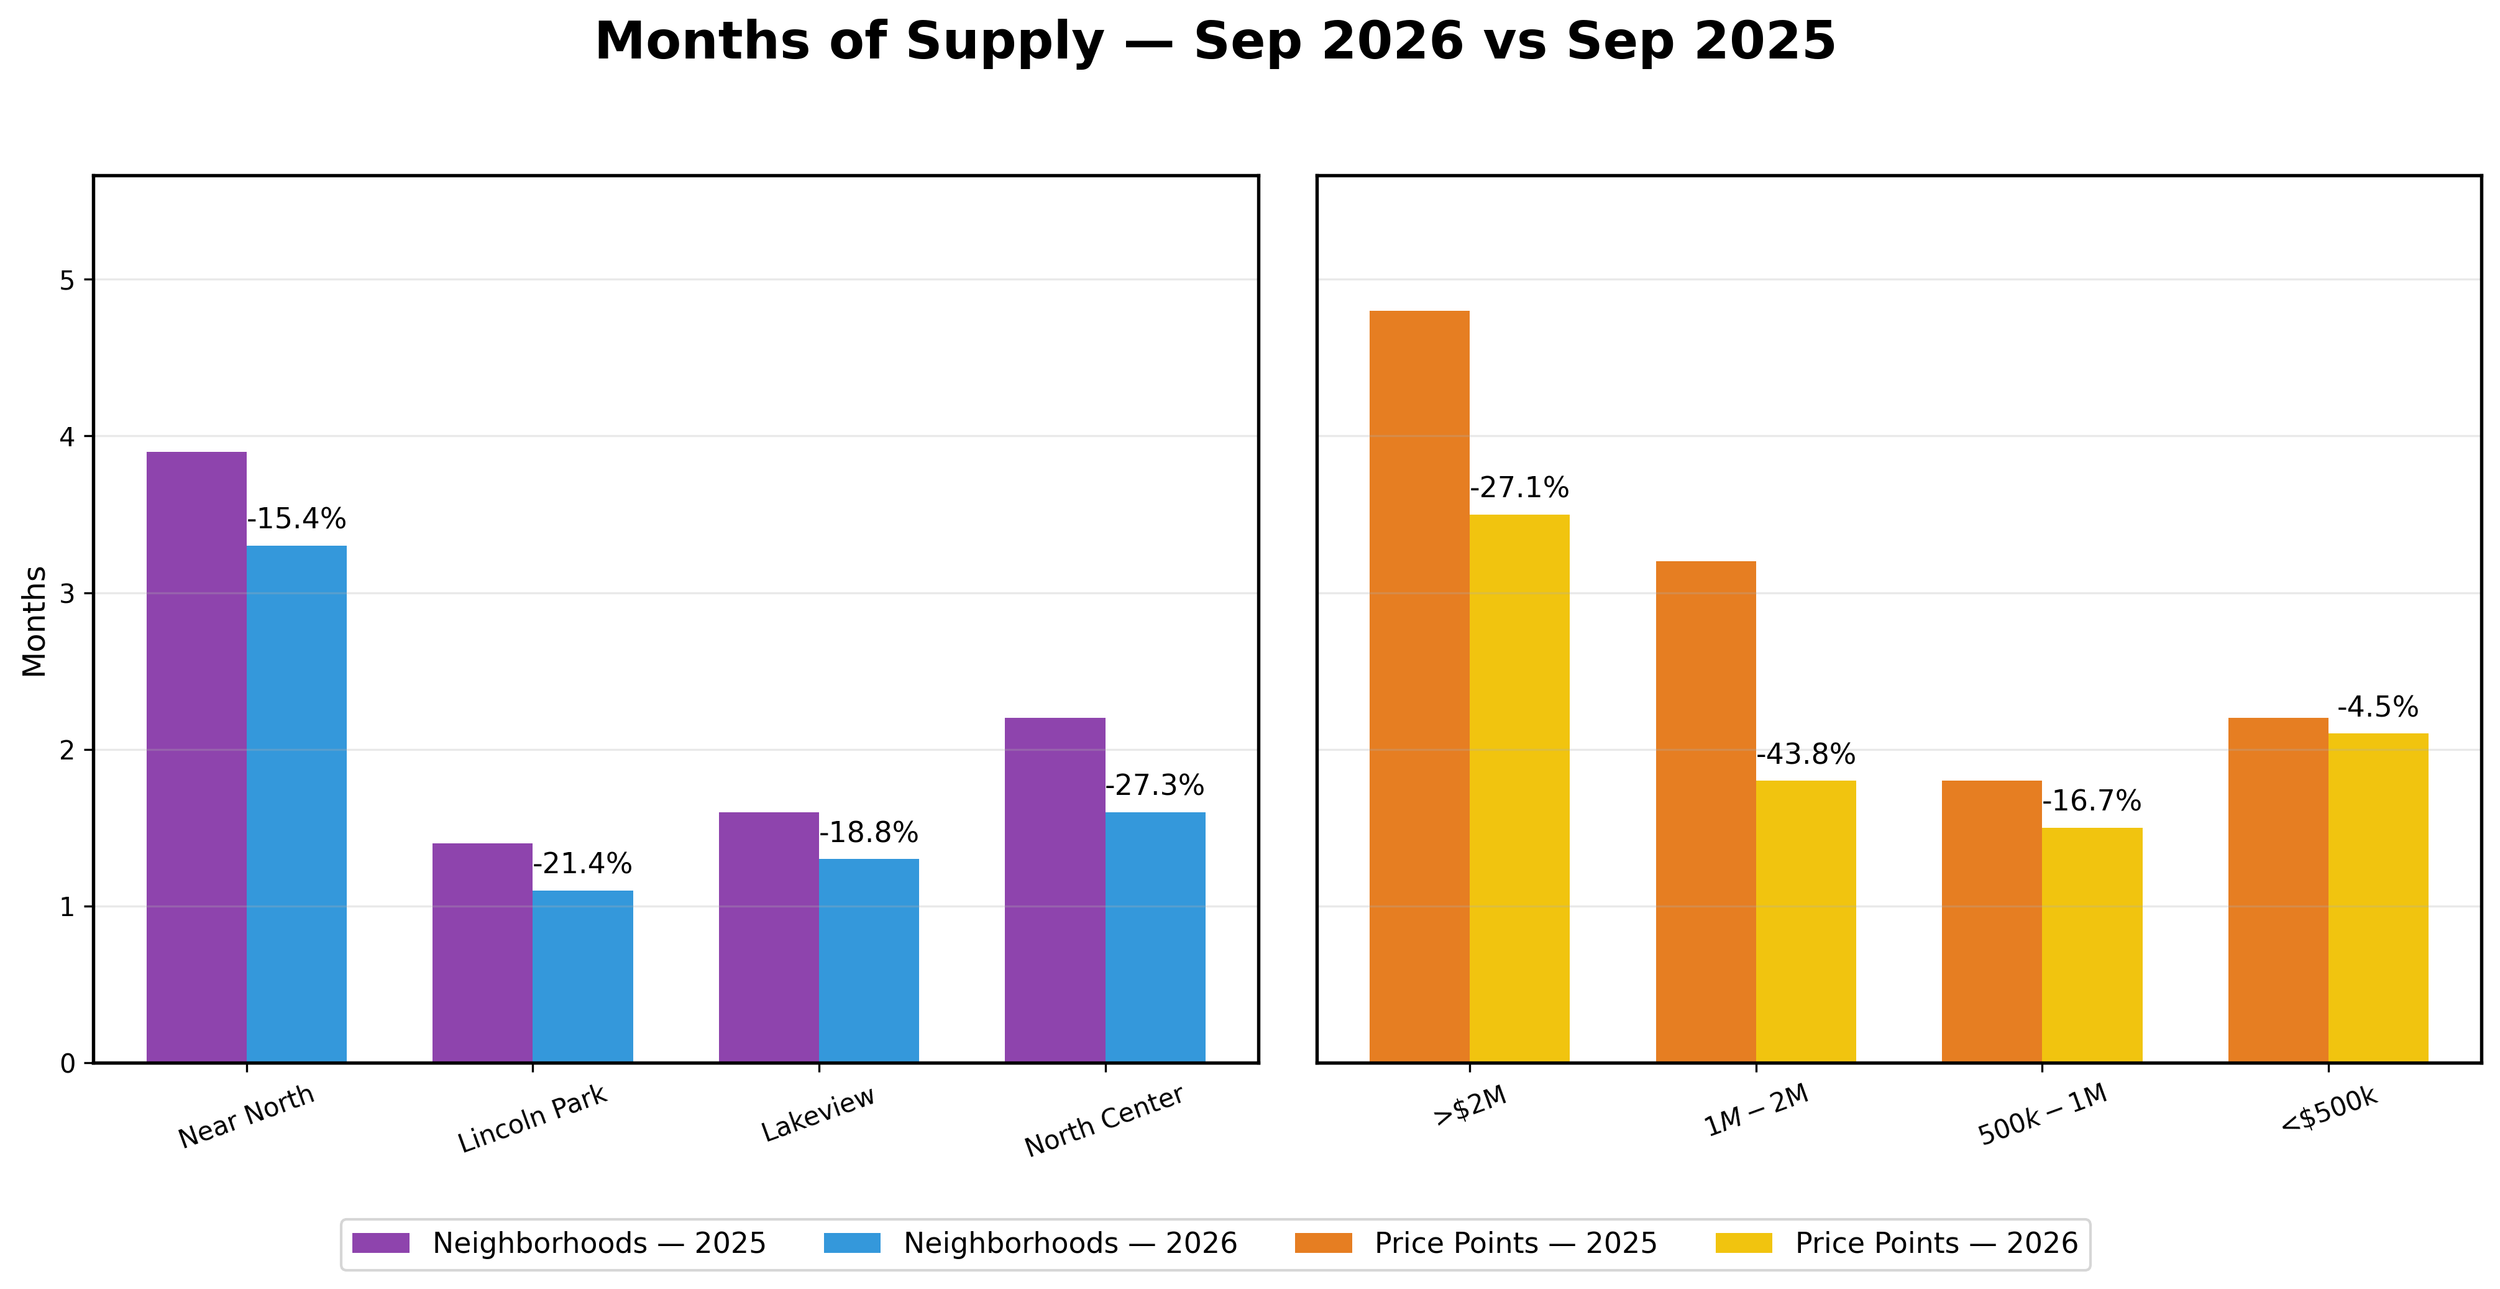
Noteworthy : Months of supply remained below prior-year levels across the market, reflecting the continued reduction in available inventory. Most neighborhoods and price segments continue to have relatively limited supply compared with the number of active buyers.
These conditions are helping the market maintain stability even as transaction activity varies from one segment to another.
Supply levels continue to favor sellers in many parts of the market, while buyers remain selective. Overall conditions remain supportive for properties that are appropriately priced and presented.
SEPTEMBER MEDIAN PRICING
Year To Date 2026 vs 2025 - Up 10.7%
September 2026 vs 2025 - Up 5.9%
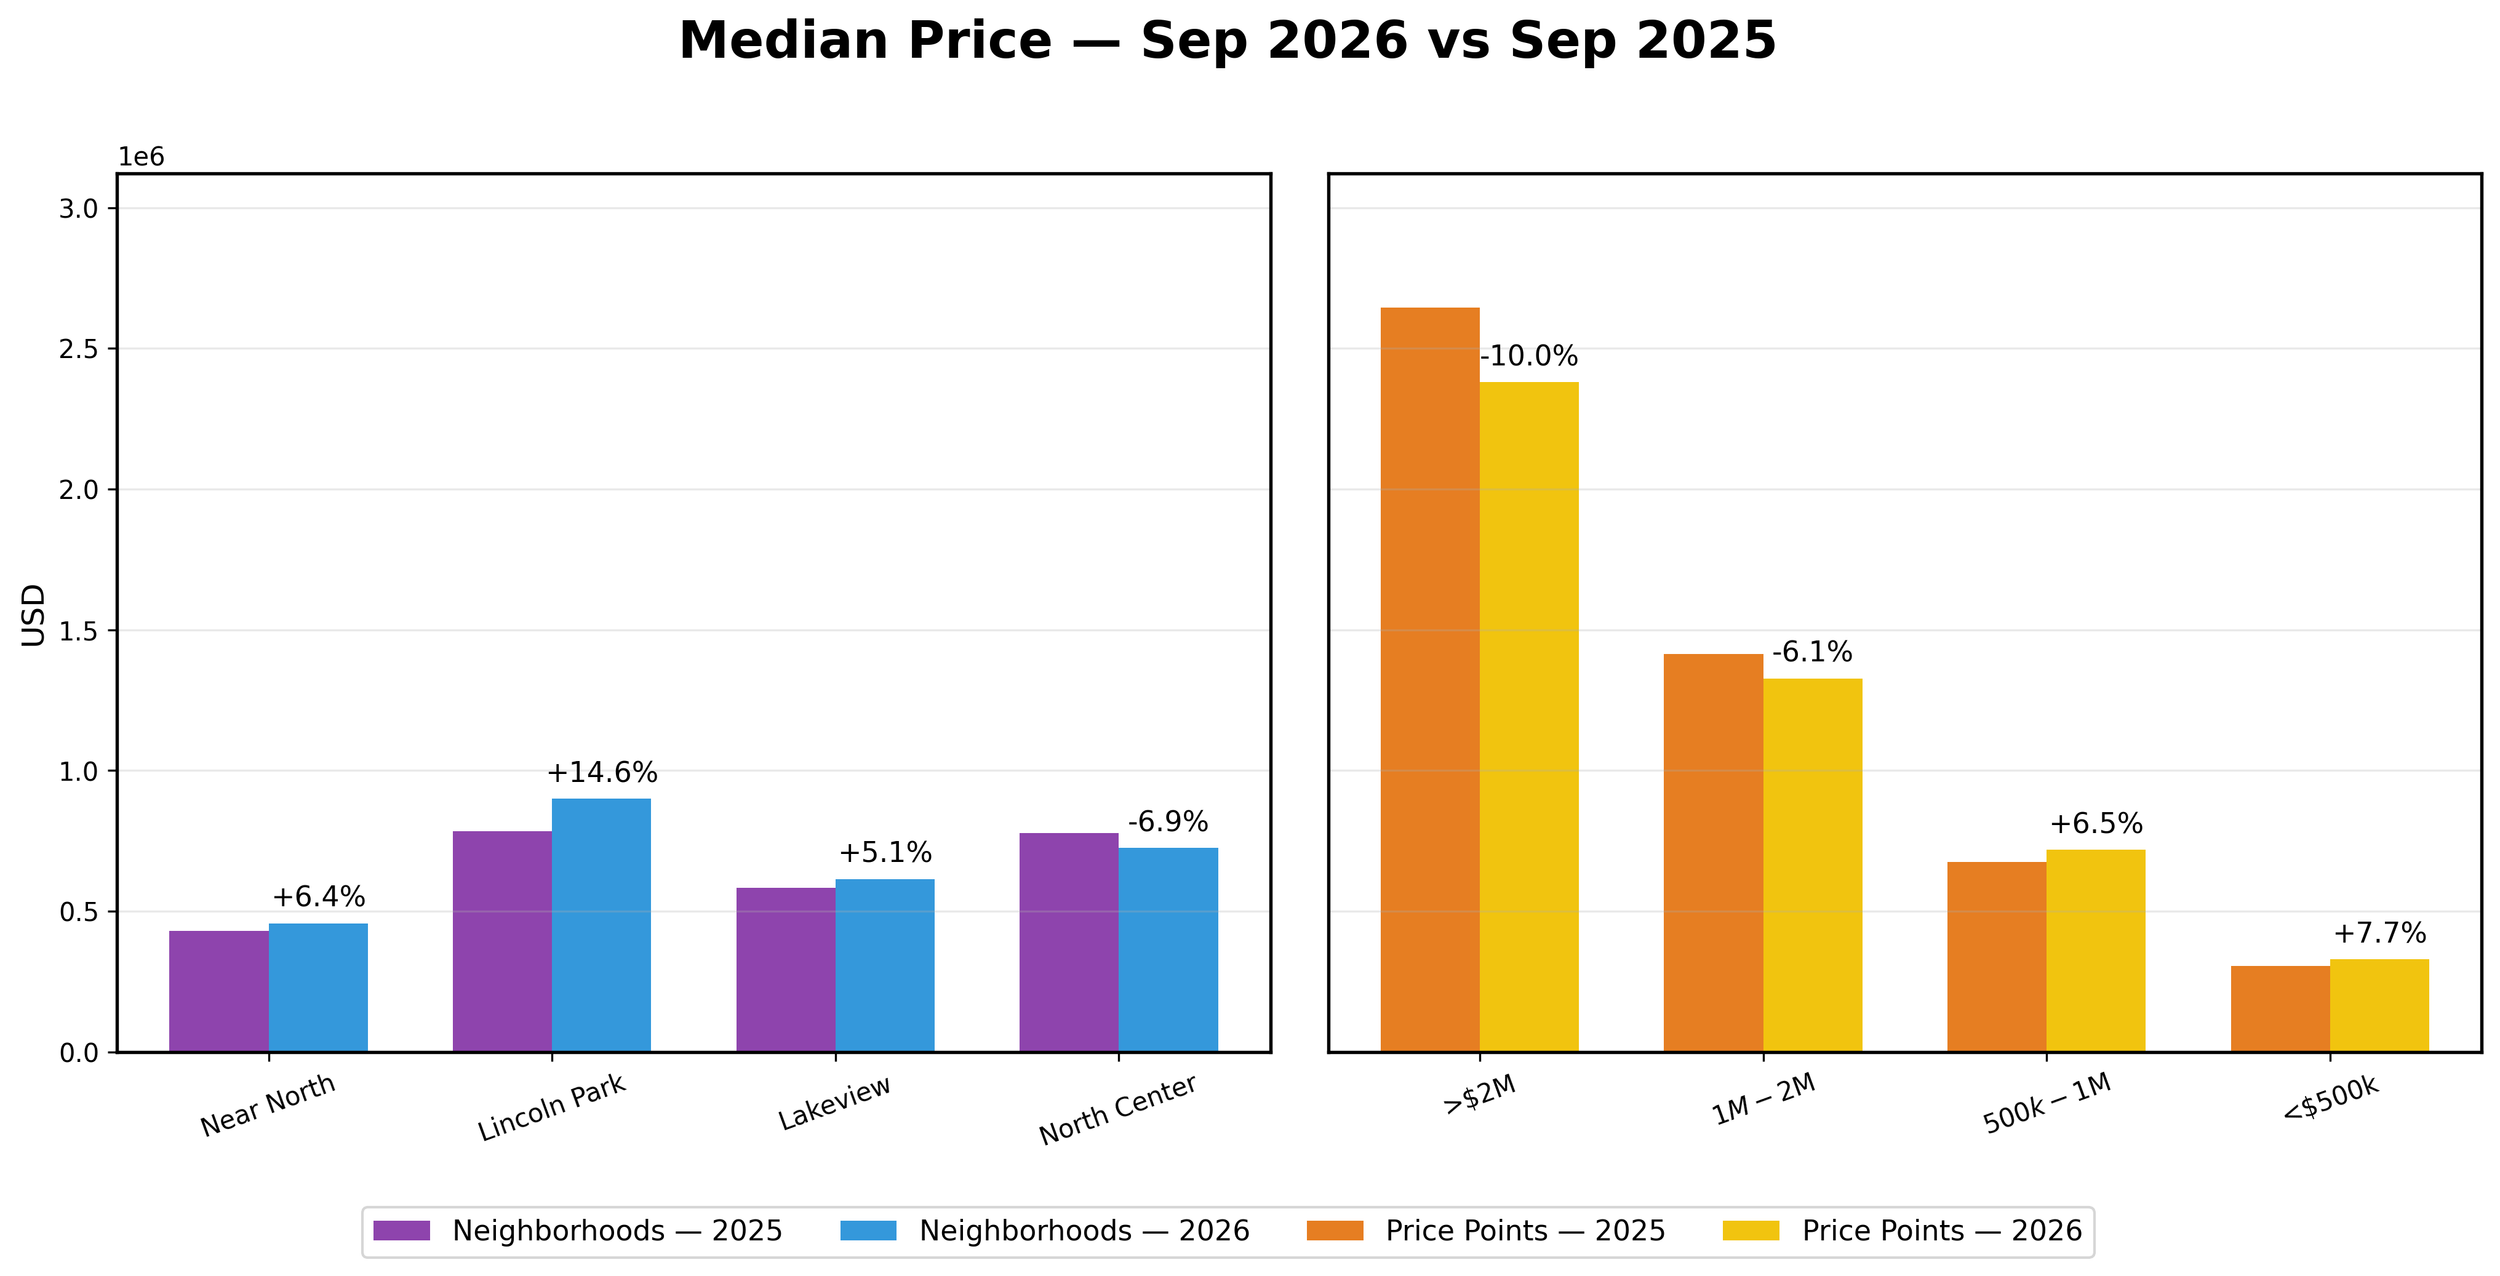
Noteworthy : Median prices were generally stable to higher across the neighborhoods, although performance varied by location and price range. Lincoln Park, Near North, and Lakeview recorded year-over-year improvement, while North Center experienced some moderation.
Price-point results were mixed, with gains in the segments below $1 million and some adjustment at higher price levels.
Pricing remains generally resilient, supported in part by limited inventory. Individual results continue to vary by neighborhood and price range, making accurate pricing especially important in the current market.
SEPTEMBER NEW LISTINGS
Year To Date 2026 vs 2025- Down 15.2%
September 2026 vs 2025 - Down 11.9%
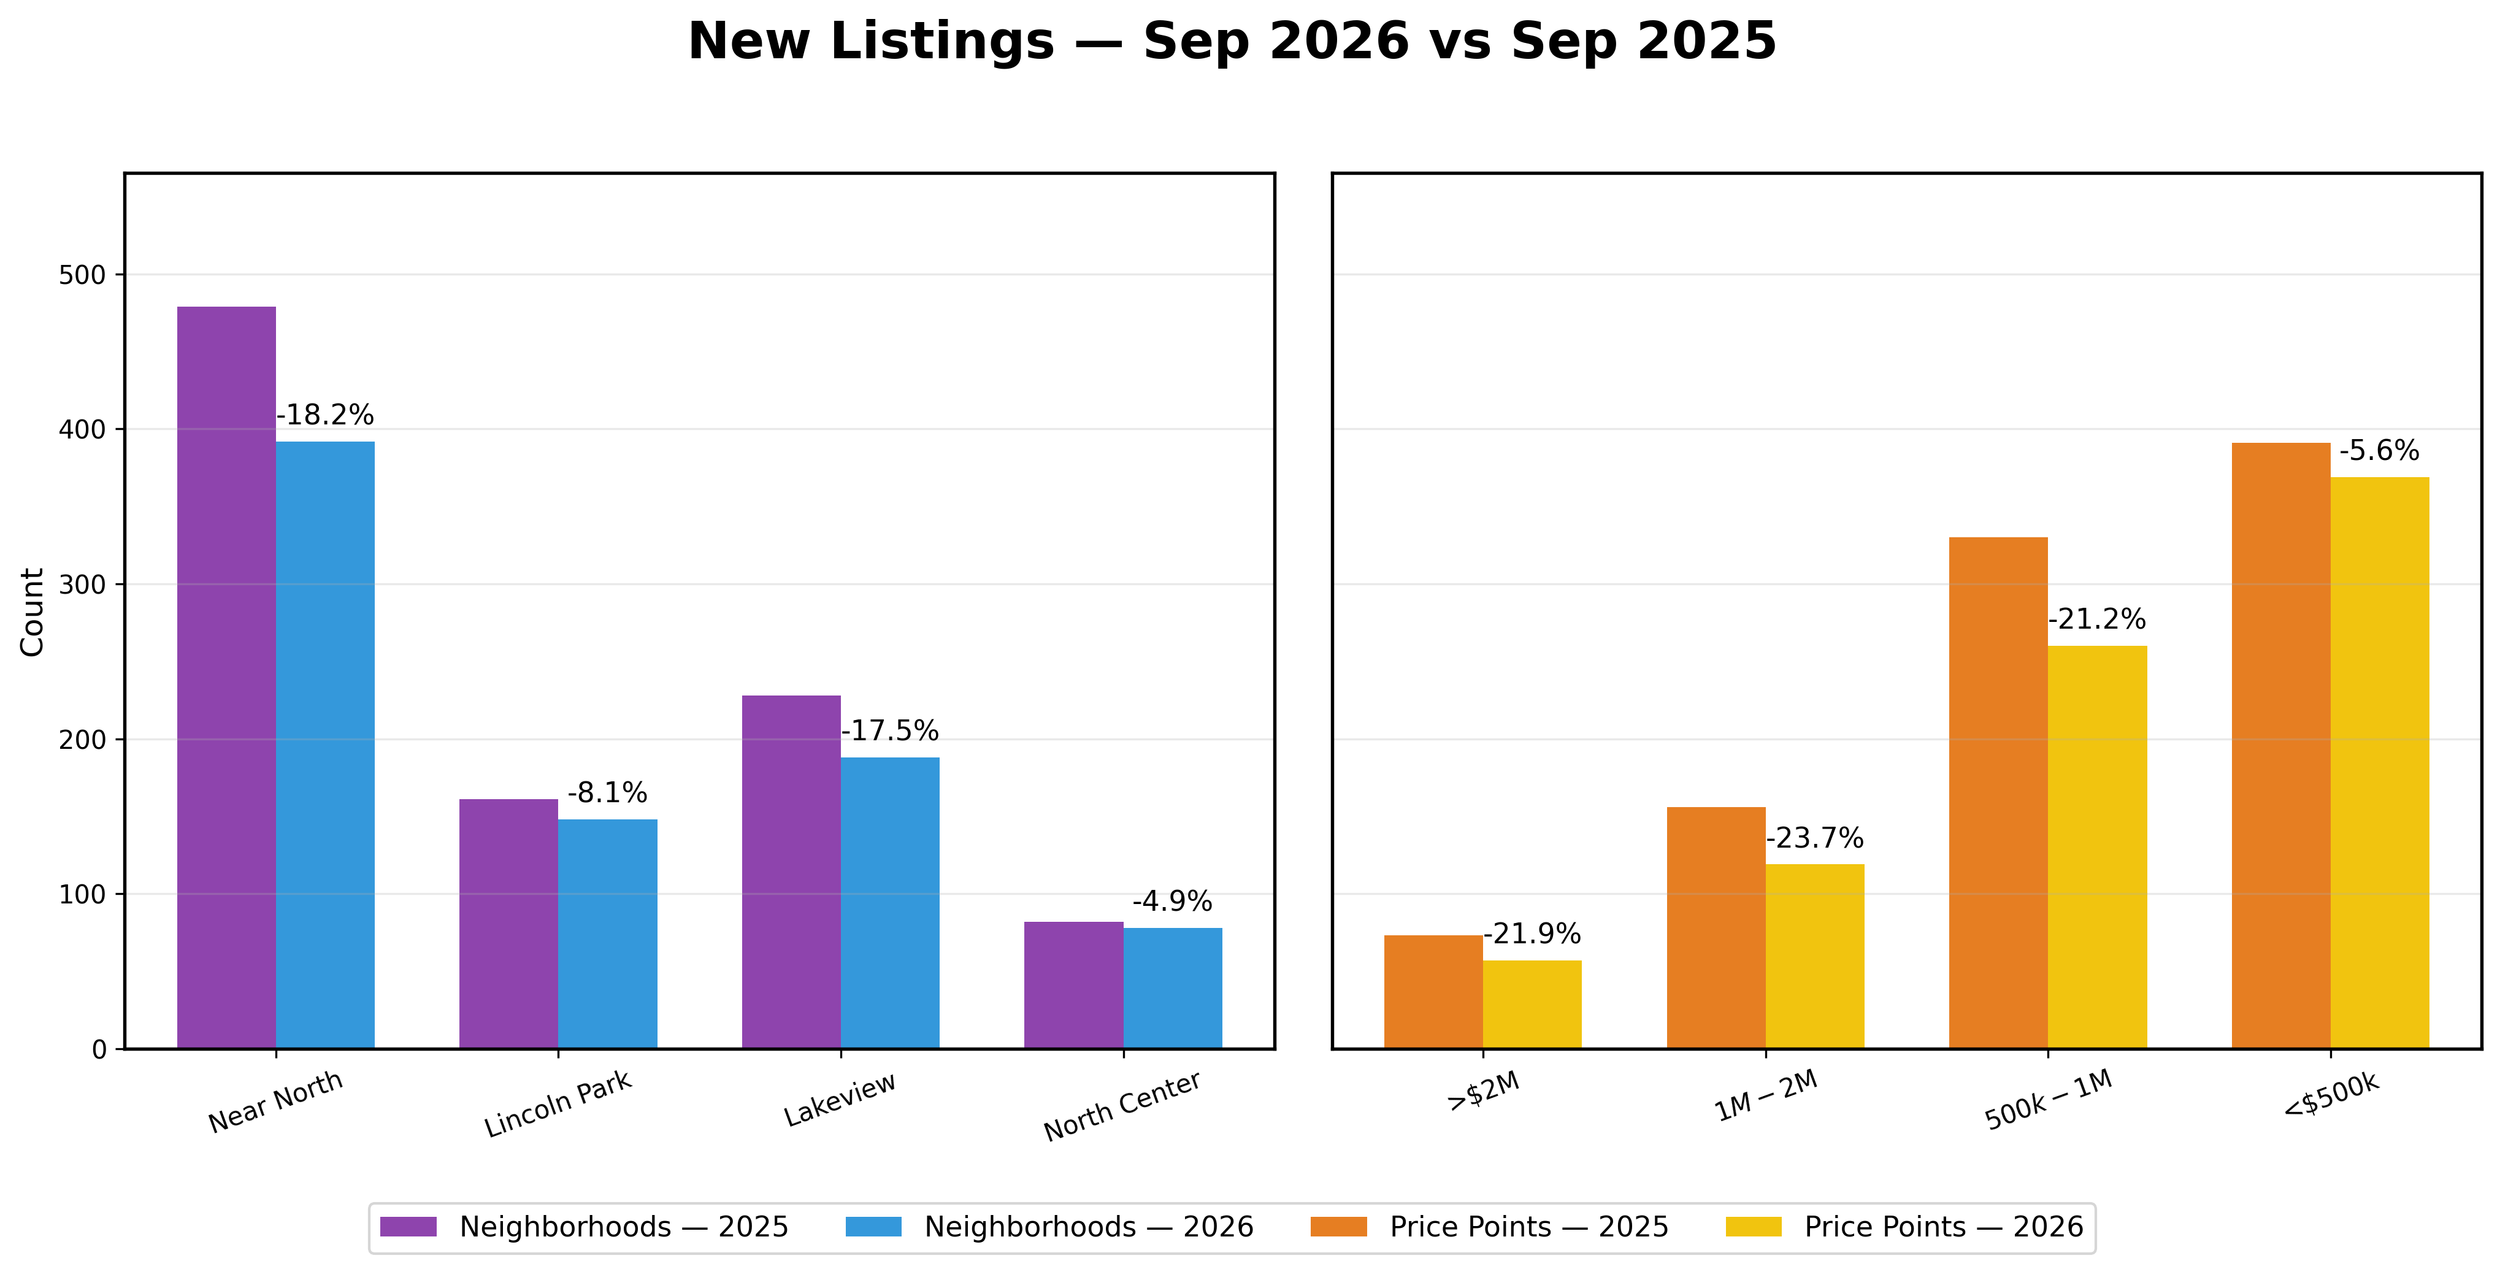
Noteworthy : New listing activity remained below the prior year across the neighborhoods and price categories. Fewer properties entering the market have contributed to the continued limited inventory available to buyers.
While new opportunities are still coming to market, the overall pace of new listings has not yet been sufficient to significantly expand buyer choice.
The flow of new listings remains relatively measured. This continues to provide support for existing inventory while creating opportunities for sellers who bring well-prepared and appropriately priced homes to market.
YOUR HOME
A logical question would be “how does all of this affect the home that I am planning to sell or potentially buy?”
Every home is unique and a detailed analysis of your property and neighborhood is a necessity to fully understand the true market value and whether this is the right time to buy or sell.
There are many criteria both objective and subjective that must be analyzed in order to get a true picture.
Internet home pricing sites that claim to calculate your home’s value using only algorithms can be wildly inaccurate. Many market analysis from real estate agents that have not taken the time to personally tour the home can also be seriously flawed. Today’s volatility demands that you get a broker who thoroughly understands this rapidly changing market.
Whether you are buying or selling a home, we would welcome the opportunity to have a conversation about your real estate needs, goals and expectations.